A Brief History: Who Developed It?
Maximum Likelihood Estimation (MLE) and Maximum A Posteriori (MAP) Learning are cornerstone techniques in statistical learning. Ronald Fisher introduced MLE in the early 20th century as a tool for statistical estimation. MAP, building on Bayesian principles, was influenced by Thomas Bayes and refined by Pierre-Simon Laplace in the 18th century.
What Are MLE and MAP?
Think of statistical inference as navigating unknown territory: MLE serves as a compass, relying solely on observed data, while MAP adds a map, incorporating prior knowledge for a more informed journey.
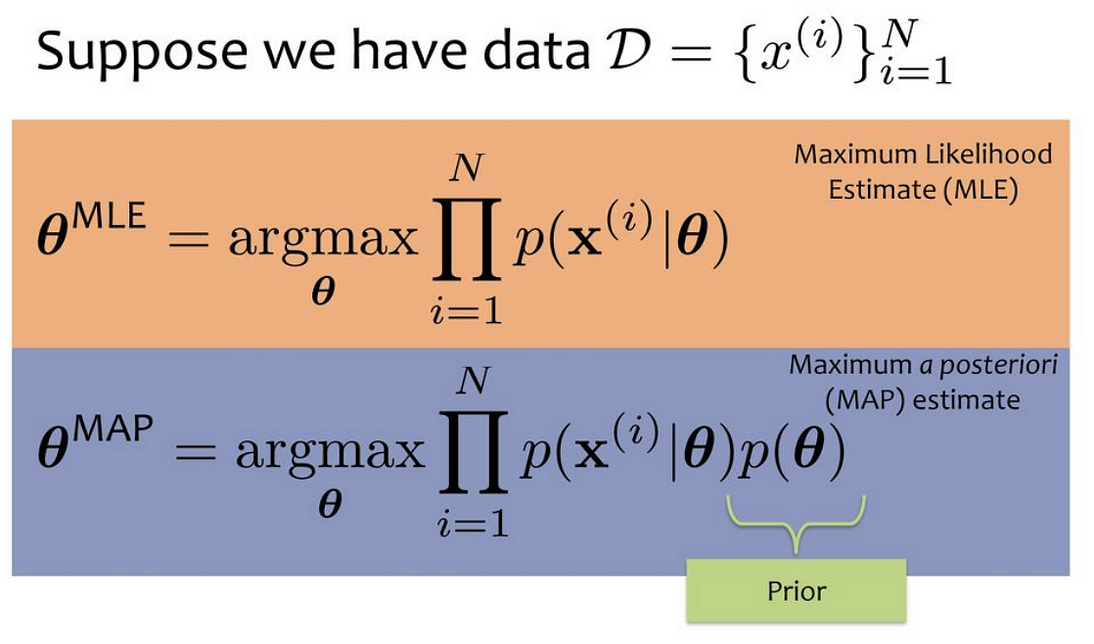
- MLE (Maximum Likelihood Estimation): Focuses on maximizing the likelihood of observed data.
- MAP (Maximum A Posteriori): Combines data with prior probabilities to compute posterior distributions, leading to more robust parameter estimates.

Why Are They Used? What Challenges Do They Address?
MLE and MAP are essential for:
- Precision in Parameter Estimation: Calculating reliable statistical parameters.
- Model Selection: MAP’s inclusion of prior knowledge aids in better decision-making.
- Solving Data Scarcity Issues: MAP is particularly effective when data is limited or noisy.
Challenges addressed include:
- Noisy Data: MAP smooths over uncertainties with prior distributions.
- Overfitting: MAP regularizes the learning process to prevent over-optimization.
- Sparse Data: Both methods excel in extracting meaningful insights from limited information.
How Are They Used?
- MLE:
- Define a likelihood function based on observed data.
- Apply optimization algorithms to find parameter values that maximize the likelihood.
- MAP:
- Define a prior probability distribution.
- Combine it with the likelihood to compute the posterior distribution.
- Maximize the posterior for parameter estimation.
For example, in spam detection, MLE identifies patterns in existing data, while MAP leverages prior probabilities, such as the likelihood of specific keywords appearing in spam emails.
Different Types of MLE and MAP
- Regularized MLE: Adds constraints to avoid overfitting.
- Hierarchical MAP Models: Used for complex, multi-level data.
Features of MLE and MAP
- MLE: Unbiased estimates but solely dependent on available data.
- MAP: Balances observed data with prior knowledge for improved accuracy.
Tools and Software for MLE and MAP
- Python Libraries: Scikit-learn, PyMC3, and TensorFlow for machine learning applications.
- R Packages: stats and BayesFactor for statistical modeling.
- MATLAB: Optimized for Bayesian and statistical analysis.
Industry Applications examples in Australian Government Agencies
- Healthcare (Medicare): MAP predicts patient risks by integrating historical and observational data.
- Climate Modeling (Bureau of Meteorology): MLE estimates weather trends from sparse, noisy datasets.
- Education Analytics (Department of Education): MAP refines student performance predictions using historical patterns.
How interested are you in uncovering even more about this topic? Our next article dives deeper into [insert next topic], unravelling insights you won’t want to miss. Stay curious and take the next step with us!