A Brief History: Who Developed It?
The Silhouette Score was introduced in 1986 by Belgian statistician Peter J. Rousseeuw: it evaluates the consistency of clusters in data. Over time, it has become a cornerstone metric for assessing clustering quality in machine learning and data science workflows.
What Is It?
Think of being at a party, grouped with your closest friends. The Silhouette Score determines how well you belong in your group (cluster) and how distinct your group is from others. A high score signifies well-formed clusters, helping data scientists validate clustering performance effectively.

Why Is It Used? What Challenges Are Being Addressed?
The Silhouette Score addresses key challenges in clustering:
- Cluster Cohesion and Separation: Measures how tightly grouped data points are within clusters and how far they are from other clusters.
- Algorithm Performance Comparison: Provides an objective way to compare clustering methods.
- Clustering Validation: Helps determine the ideal number of clusters for a dataset.
Without this metric, clustering evaluation risks being subjective and inconsistent.
How Is It Used?
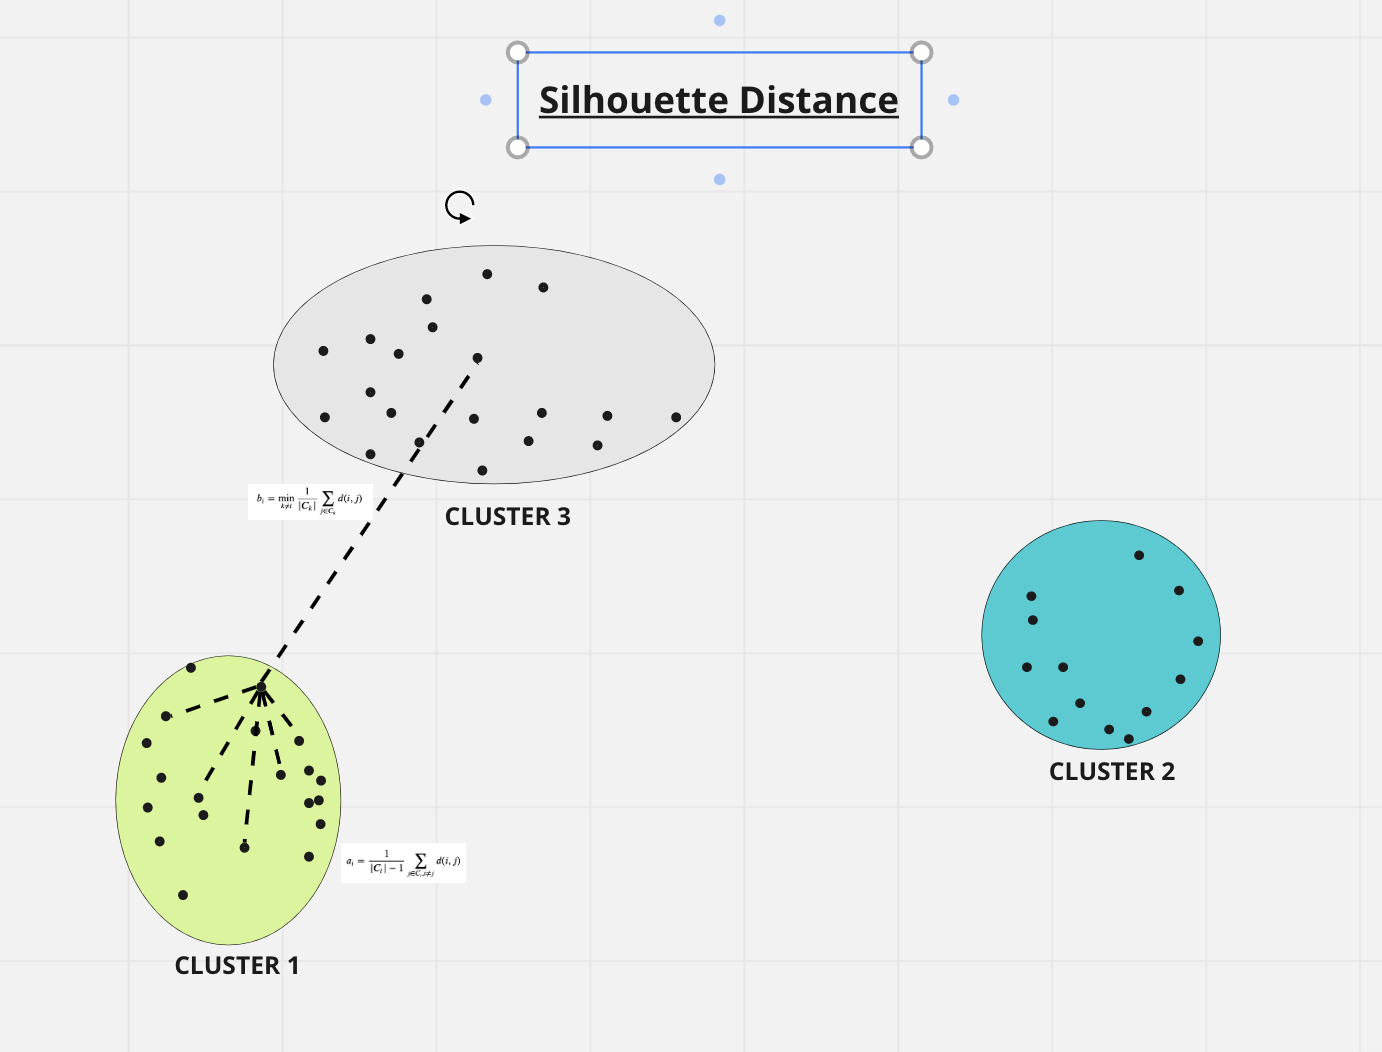
The Silhouette Score is calculated by:
- Measuring the average distance between a data point and other points in its cluster.
- Measuring the average distance between a data point and points in the nearest neighboring cluster.
The score ranges from -1 to 1:
- 1: Perfectly distinct and cohesive clusters.
- 0: Overlapping or ambiguous clusters.
- -1: Misclassified data points and poor clustering.
Tools like Scikit-learn streamline the calculation, making it accessible for quick clustering evaluations.
Different Types
Although unique in its approach, the Silhouette Score pairs well with:
- Dunn Index: Evaluates compactness and separation of clusters.
- Davies-Bouldin Index: Assesses clustering quality by considering compactness and distinctness.
These metrics provide complementary insights into clustering performance.
Different Features
Key features of the Silhouette Score include:
- Scalability: Works well with datasets of varying sizes.
- Versatility: Applicable to multiple clustering algorithms.
- Visualization-Friendly: Supports graphical interpretations through Silhouette plots.
Different Software and Tools
Top tools for implementing the Silhouette Score include:
- Scikit-learn: Python’s most widely used library for clustering analysis.
- Matplotlib: Facilitates visualizing Silhouette Scores with intuitive plots.
- R Packages: Libraries such as cluster provide integrated Silhouette Score functionalities.
Industry Application Examples in Australian Governmental Agencies
- Healthcare Insights: Segmenting patient demographics to optimize health services.
- Transport Planning: Grouping travel behavior data to enhance urban development strategies.
- Educational Analysis: Clustering school performance metrics to shape data-driven policies.
How interested are you in uncovering even more about this topic? Our next article dives deeper into [insert next topic], unravelling insights you won’t want to miss. Stay curious and take the next step with us!