A Brief History: Who Developed Principal Component Analysis?
Principal Component Analysis (PCA), first introduced by Karl Pearson in 1901, revolutionized data analysis by uncovering the underlying patterns in datasets. Harold Hotelling later extended its applications in the 1930s, cementing PCA as a cornerstone of statistics, data science, and machine learning.
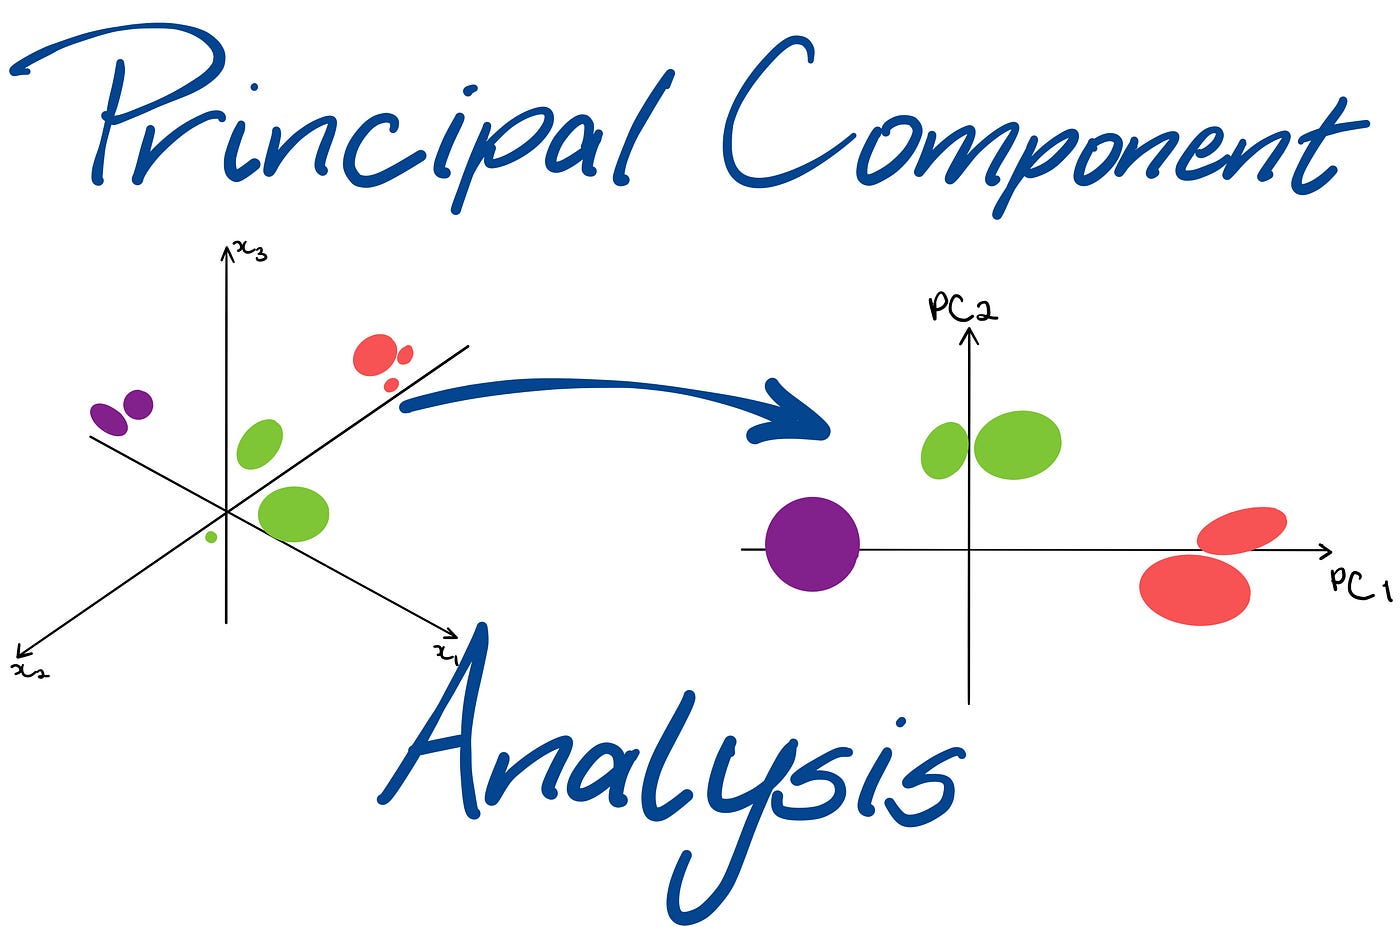
What Is Principal Component Analysis?
PCA is a dimensionality reduction technique that simplifies complex data into its essential components. Imagine PCA as a magnifying glass for your data, helping you zoom in on the most critical features while filtering out the clutter. It transforms complexity into clarity by revealing hidden structures and relationships in datasets.

Why Is PCA Used? What Challenges Does It Address?
PCA addresses key challenges in data analysis:
-
- Dimensionality Reduction: Condenses large datasets into manageable forms for analysis and visualization.
-
- Data Compression: Reduces storage requirements while preserving meaningful information.
-
- Noise Elimination: Filters out irrelevant data, improving the accuracy of analytical models.
Its impact spans multiple industries, including finance, healthcare, environmental studies, and image recognition, where clarity and efficiency are crucial for decision-making.
How Is PCA Used?
PCA works through a systematic approach:
-
- Data Standardization: Normalizes variable scales to ensure comparability.
-
- Covariance Matrix Calculation: Measures relationships between variables.
-
- Eigen Decomposition: Identifies principal components explaining data variability.
-
- Transformation: Projects data onto a lower-dimensional space while retaining its essence.
PCA acts like a powerful set of noise-canceling headphones, allowing you to focus on the melody (key patterns) while muting the static (irrelevant data). This ensures that only the most significant aspects of your data stand out.
Types of PCA
-
- Standard PCA: Suited for linear datasets.
-
- Kernel PCA: Captures non-linear data relationships.
-
- Sparse PCA: Highlights sparse data representations for improved clarity.
Key Features of PCA
-
- Scalability: Effectively handles large datasets.
-
- Clarity: Provides focused insights by isolating essential data.
-
- Flexibility: Adapts to various domains and applications.
Popular Tools for PCA
-
- Scikit-learn: User-friendly modules for PCA.
-
- MATLAB: Advanced tools for statistical and dimensionality reduction tasks.
-
- R (prcomp): Reliable for robust PCA implementation.
Real-World Applications: Australian Government Use Cases
-
- Urban Development: PCA clusters and analyzes census data to optimize resource allocation.
-
- Healthcare Systems: Streamlines patient demographic data for enhanced predictive models.
-
- Environmental Research: Identifies critical climate patterns for informed policy-making.
How interested are you in uncovering even more about this topic? Our next article dives deeper into [insert next topic], unravelling insights you won’t want to miss. Stay curious and take the next step with us!