A Brief History: Who Developed It?
Spectral clustering was developed in the late 1990s: it quickly became a cornerstone for analyzing non-linear data. Combining graph theory and linear algebra, it offered a robust solution for handling datasets with intricate relationships. Today, it is widely used in machine learning and data analysis applications.
What Is It?
Think of grouping friends into teams based on how they interact. Instead of tracking interactions one by one, you create a visual map of their relationships. Spectral clustering works the same way: it identifies meaningful clusters using data connections, making it ideal for complex, high-dimensional datasets.
Why Is It Used? What Challenges Are Being Addressed?
Spectral clustering solves key challenges in data analysis:
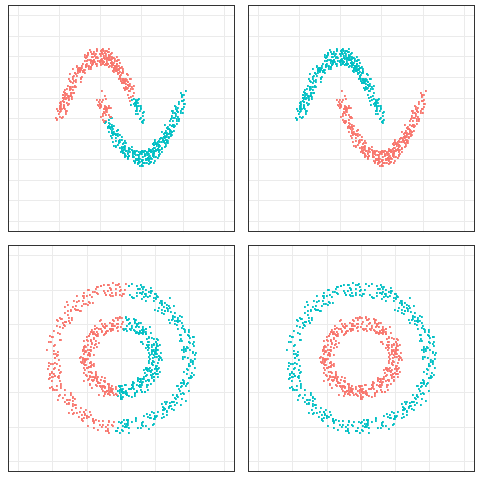
- Handling Complex Data Structures: Ideal for datasets with non-linear relationships.
- Flexibility in Cluster Shapes: Works with clusters of varying shapes and sizes.
- Scalability: Efficiently processes large-scale datasets.
Without spectral clustering, extracting meaningful patterns from non-linear data can be inefficient and imprecise.
How Is It Used?
Spectral clustering involves three main steps:
- Construct a similarity graph, where nodes are data points and edges reflect relationships.
- Transform the graph into a Laplacian matrix.
- Use eigenvalues and eigenvectors to group the data into clusters.
Tools like Scikit-learn and MATLAB simplify this process, making spectral clustering accessible for data scientists at all levels.
Different Types
Spectral clustering offers variations to suit different use cases:
- Normalized Spectral Clustering: Optimizes cluster stability.
- Multilevel Spectral Clustering: Scales efficiently for very large datasets.
These adaptations ensure versatility across industries and applications.
Different Features
Key features of spectral clustering include:
- Graph-Based Approach: Transforms data into graphs for insightful clustering.
- Dimensionality Reduction: Uses eigenvalues to simplify and clarify data patterns.
- Adaptability: Works with datasets of varying sizes and complexities.
Different Software and Tools
Popular tools for spectral clustering include:
- Scikit-learn (Python): A widely used library for machine learning, offering a simple implementation of spectral clustering.
- MATLAB: Provides robust graph-based clustering modules with visualization options.
- R Libraries: Packages like igraph and cluster support spectral clustering and graph analysis.
Industry Application Examples in Australian Governmental Agencies
- Traffic Flow Analysis: Clustering transport data to optimize road and public transit systems.
- Healthcare Data Segmentation: Grouping patient data for better resource allocation and service planning.
- Climate Data Modeling: Analyzing weather patterns to inform environmental policies and strategies.
How interested are you in uncovering even more about this topic? Our next article dives deeper into [insert next topic], unravelling insights you won’t want to miss. Stay curious and take the next step with us!